
The advanced interface is intended only for Advanced users that know what they are doing. It allows to access a lot more parameter than the Main interface, but changing some parameter without knowing what you are doing can easily break you current configuration.
Opening the backend interface
The backend interface can be opened through the Windows Start Menu. Instead of opening Augmenta with the Augmenta shortcut, launch the Augmenta - Backend GUI link instead, and the backend interface will be opened in the app windows instead of the main interface.
Elements
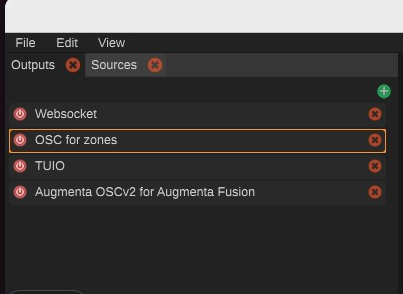
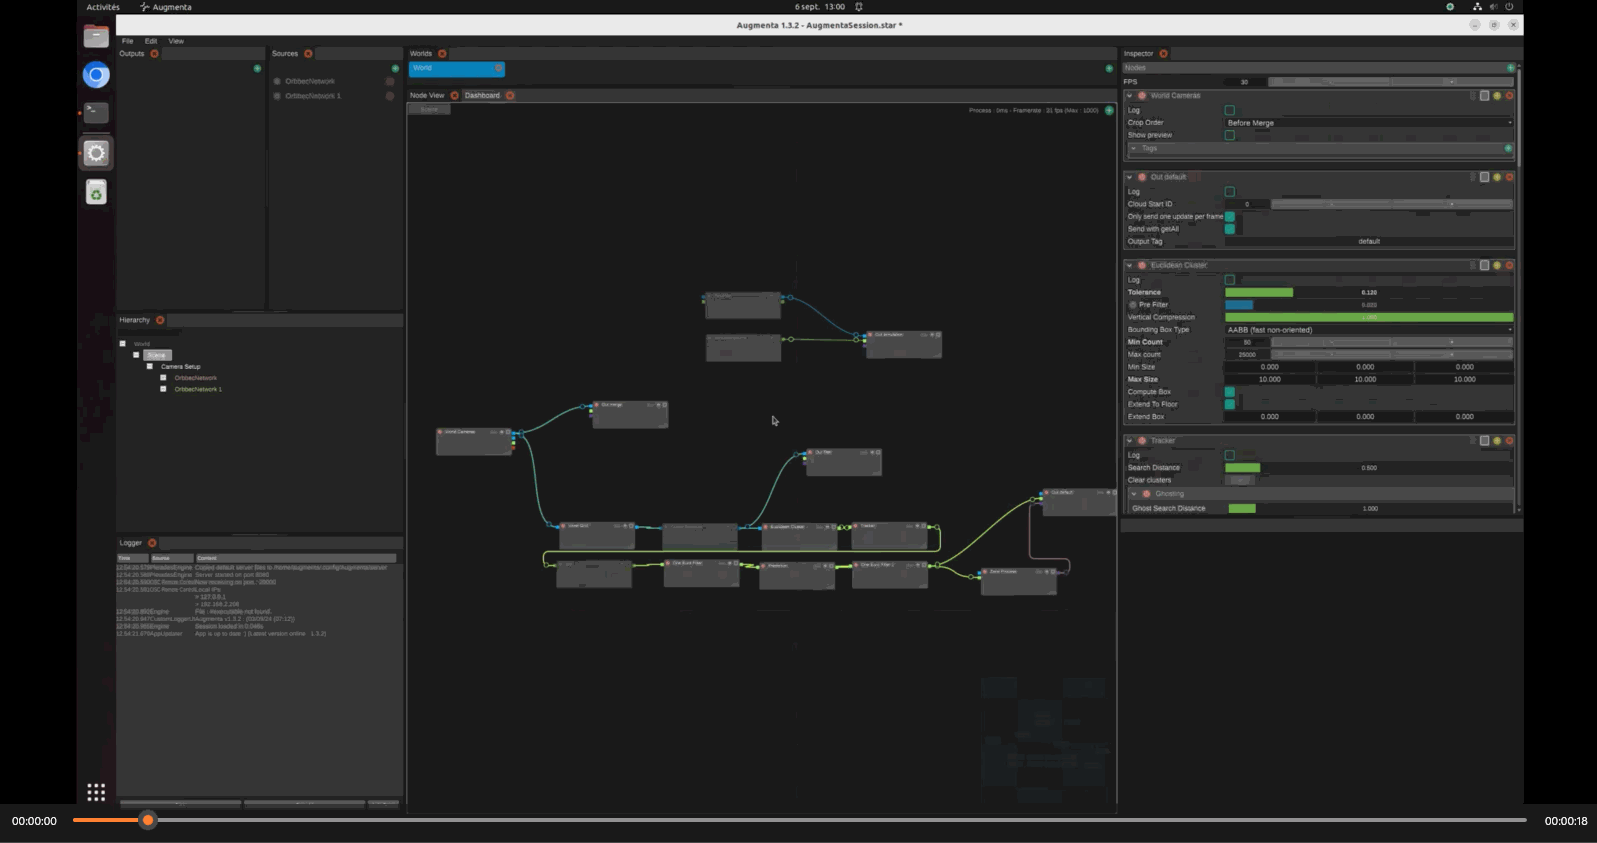
Inspector
The inspector panel is a context menu that will display the parameters of the currently selected items. If you want to change the parameters of any object in the app, click on it and its properties will appear in the inspector and you will be able to change the value you are looking for.
Worlds
The Worlds panel at the top contains all the Worlds that currently exist in the software. Most of the users only need a single world. Each world has its Objects Hierarchy as well as a set of outputs. Each world represents a unified tracking space.
For example, if you have a room where you want to track humans and have a touch interaction on one or more walls, you can put all of the tracking processing in a single world, as all of this data is related to a unified tracking setup.
You could as well use one world for the human tracking, and another one for the interactive wall. This setup would be simpler, but would not allow to do cross-worlds (between human tracking and touch wall) processing in the software.
If you have unrelated tracking spaces, like 2 touch surfaces, each one for a difference interactive app, you could split it in two worlds.
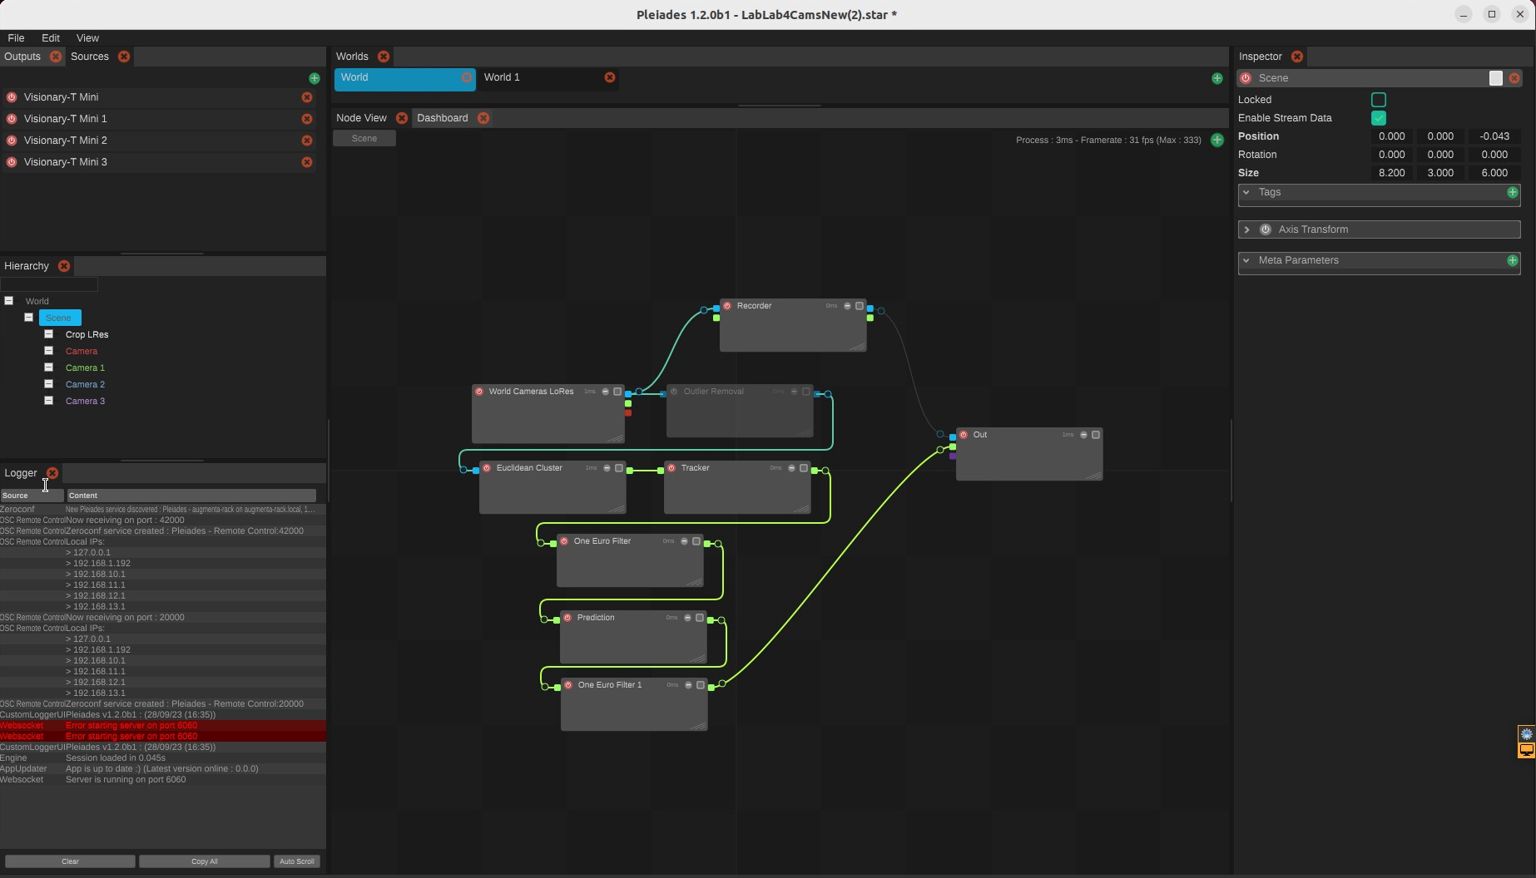
Sources
The Sources panel (in the top left of the interface) displays the data sources that were added to the software. You can enable/disable by clicking on the button on the left of each source. If the source has an issue and is not providing data, there will be a "warning" sign on the left.
The sources you see here are application-wide. They are shared between all the worlds in the current app session. This means you can access the data of any source in any world.
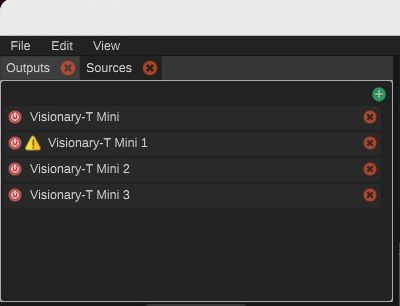
Outputs
The Outputs panel holds all the outputs of the current world. Click on them to see to display their parameters in the inspector. There is an output that is present by default, which is the WebSocket output. This output is a server that can accept incoming requests to get the data through the binary WebSocket protocol. This one is a dynamic output, it can accept multiple client data request.
Those outputs are only per-world. If you switch to another world you will not see the same outputs.
You can create a new output by clicking on the green + at the top of the panel.
Worlds
If there are multiple worlds holding different processing pipelines (for example one world for a floor tracking and another one for a wall tracking), you might want to check what goes on in each of them. To switch between worlds, just click on the world tab (at the top of the window). You will see that when doing so the hierarchy tab content will change to display the objects of the new world. If the Node Graph of the new world does not appear, click on the scene object in the hierarchy to display it.
Node graph
The node graph hold the processing pipeline that turns the incoming data from the sensors in a correct tracking result.
What can be interesting in this panel is to connect some nodes to the "Out" node. Putting a link between any node and the output means that data can flow between them. If the link is coloured it means that it is enabled and will transmit data. If it is greyed out it means that data will not flow.
In some cases, we leave some links connected and disabled (greyed out) just to be able to enable them to monitors what happens at this stage of the processing.
The same goes for nodes, they can be disabled, meaning that they won't do any processing, just passing data from its input to its output (if it can).
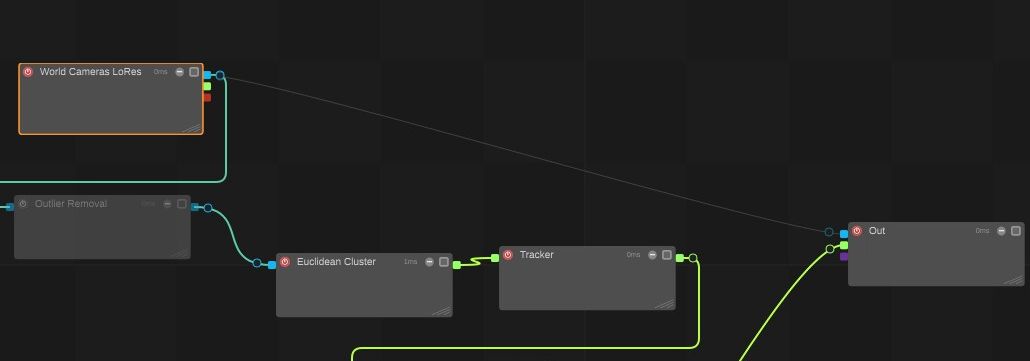
In the capture above, we can see that there is a greyed out link between World Cameras LoRes to Out. If we enable it, it will pass the input pointcloud to the out directly. This will make the input cloud visible in the web interface for example. It can be useful sometimes when troubleshooting.
Navigating the Node graph
To navigate through the graph you can:
- translate in any direction: Mouse Whell Click
- vertical translate: Scroll Mouse Wheel
- zoom: Shift + Scroll Mouse Wheel
In case you get lost in the graph view, you can always press the ‘h’ key of your keyboard to set back the graph view at the origin point.
Adding nodes
You can add nodes by right clicking on the canvas, a selection menu appears with all the available nodes. You can select any one there and it will appear in the graph.
You can also duplicate existing nodes by copy-pasting them (Ctrl+C;Ctrl+V).
Selection
You can select a node by left-clicking it. This will put its parameter in the inspector. You can also select multiple nodes. This can be handy to duplicate parts of a graph. Please be aware that as of now there is a bug that makes connections disapear between duplicated nodes, you will have to rewire the new nodes together manually.
Hierarchy
The hierarchy panel shows the objects present in the world.
By default, a Scene object is added to the hierarchy. A scene object holds a processing graph. All objects contained in the Scene object will be available for the Scene's processing graph.
If you want to process sensor data in the current scene, you will have to create a "camera" object and link it to a Source.
If you want to add any 3D object that can be used by the processing graph you have to add it through the hierarchy. They can be crop volumes, collision zones, etc...
As for elements in the graph, you can duplicate an element by copy-pasting it.